In traditional models of evaluation these are often referred to as ‘outputs’, but we like to think about ‘what we did’ in a broad way that might cover what was delivered, but also how it was delivered and how any challenges were overcome. This gives a rounded, more engaging and interesting story, which can help demonstrate the uniqueness of the work, and can really ground the learning, behaviour change or wider outcome into the delivery aspects of the work.
When we work with initiatives to help them understand how the activities they deliver contribute to the outcomes or impacts that are important to them, we use a process we call outcome mapping.
ℹ️Explore the background to our outcome mapping approach→
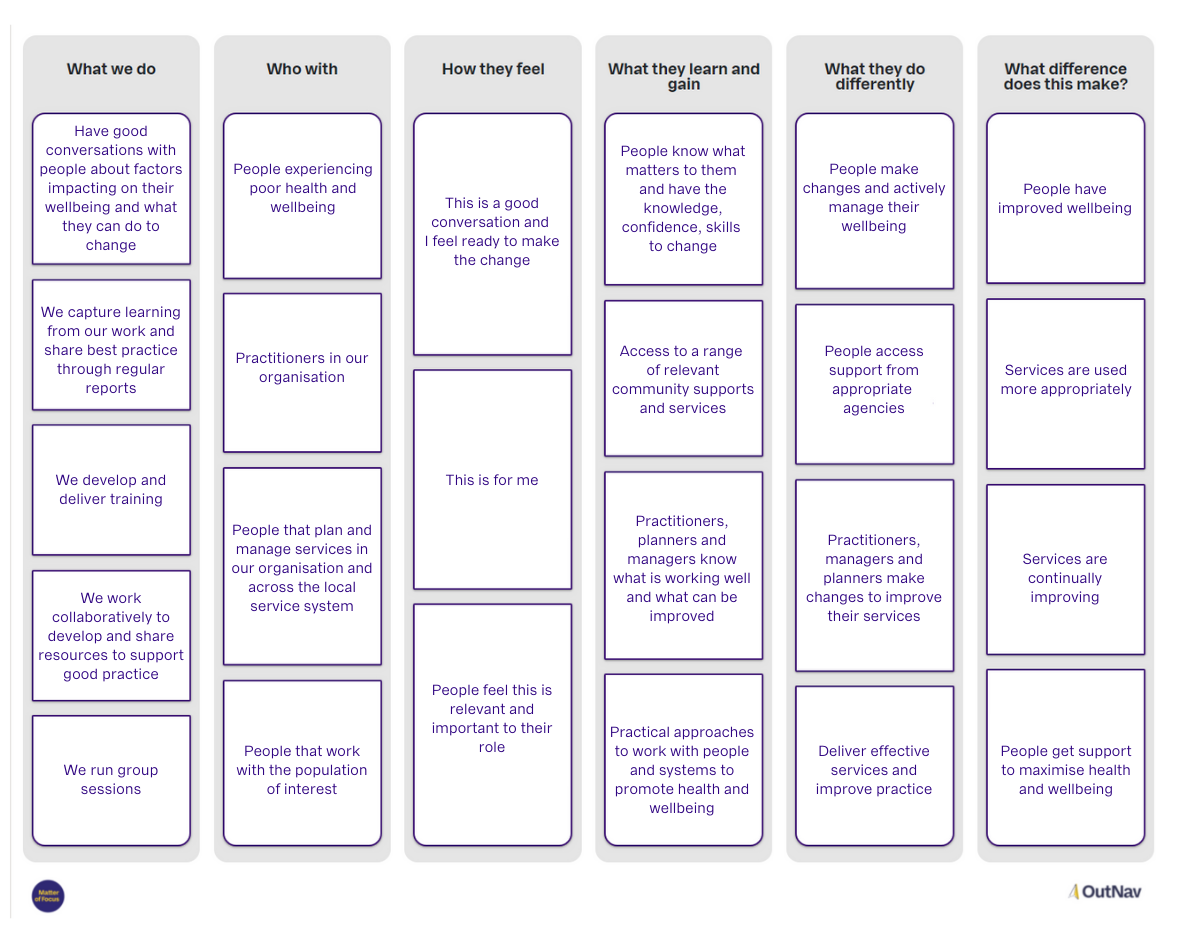
The resulting outcome or impact map sets out a theory of change across our simple framework of six column headings; What we do, Who with, How they feel, What they learn and gain, What they do differently, What difference they make.


Reporting on ‘What we do’
It is interesting working with many different clients and organisations to set up their outcome maps, and to start to tell their contribution story. It should be easy to evidence and be confident in the column that explains ‘what we do’ but it can also be a struggle to put into words how a programme or initiative has been delivered and what changed over time.
Here are a few tips to help you evidence what you do:
- Explain what was done. Use pictures, or other images to show how it was done – it’s great to actually see people engaged in activities!
- Record what went well, what the challenges were and how these were overcome.
- Numbers might be relevant for some of this, e.g. number of sessions delivered.
- Start as soon as possible, then refine and update the description as the project progresses.
Regular recorded reflections on the delivery of a programme or initiative creates rich data that can capture issues that may be lost in the longer term. Many of our clients use a reflective impact log to record their own reflections on delivery.
Download a free template from this post: 3 feedback tools to help you track your outcomes and impact.

Reporting on ‘Who with’
Who is being engaged and involved is the core of work seeking people-based change.
We believe that it makes for a stronger and clearer contribution story if there is a separation between what was delivered ‘what we did’ and who was engaged and involved ‘who with’.
This part of any outcome map provides nice opportunities for quantitative data, graphs and numbers. It can be good to record who came in terms of types of people, numbers of sessions, repeat returners, social media and web stats or reach of a programme. These are the things that lend themselves to traditional quantitative data visualisation like graphs or pie charts.
While we are geeking-out on playing with these numbers it is important to also tell the story of how a programme or initiative engaged people. For many initiatives we work with, a lot of effort has gone into ensuring that the people that were involved were the right people, were the intended recipients of whatever work was being planned, and were engaged throughout the work where appropriate.
Alongside the numbers it is important to capture:
- How did you identify the right people for this work?
- What did you do to ensure they knew about the programme or initiative so they could engage?
- What hurdles to engagement did you overcome?
- What were the key risks around engagement and did they materialise?
- What did you do to make sure the activities were engaging for the intended recipients?
Anchoring your contribution story in a clear description of what you did and who with will help to clearly demonstrate the links between these and higher-level outcomes when it comes to reporting.

For more on telling a compelling outcome-focused story of the contribution of your work, see our post: Report in an outcome-focused way
How are you recording the activities you are delivering? If you want help with this take a look at this OutNav report from our demo project - The Wellbeing Service. (Please note, OutNav reports will not display on small screens.)
View the OutNav report