Although we mention funding and annual reports, we take the view that reporting should be part of the process of learning and improvement, not simply an activity tacked on at the end. For the background on working in this way, please see our post Report in an outcome-focused way.
This post looks at the OutNav features that support dynamic and visually engaging reporting.
This is the fifth of six key posts that guide you through OutNav’s features:
- Outcome maps – the cornerstone of OutNav
- OutNav supports team and partnership working
- OutNav streamlines your data and evidence
- Track your progress and impact in OutNav
- Create visual contribution reports in OutNav (you are here)
- Ongoing learning and support with the OutNav Community
It’s important to say that you get out of OutNav what you put in. The content of the reports you can run in OutNav is generated by the work you put in to assessing your evidence and progress towards outcomes and impact. We looked at this in Track your progress and impact in OutNav.
We will look at the formatting features in OutNav that can be used to make your reports visually appealing later in this post. First, let’s look at the reporting function in OutNav.
Interactive live reporting
OutNav’s live reporting feature allows you to share your story widely and will also really support you in your ongoing learning and improvement.
OutNav supports an iterative analysis process – allowing you to start with tentative analysis, which you then improve and refine over time. This means you can start telling a story quickly, frequently sharing your progress so far, for ongoing assessment and improvement.
If you want to jump straight into looking at a live OutNav report, take a look at this one that has been shared from a demonstration OutNav project:
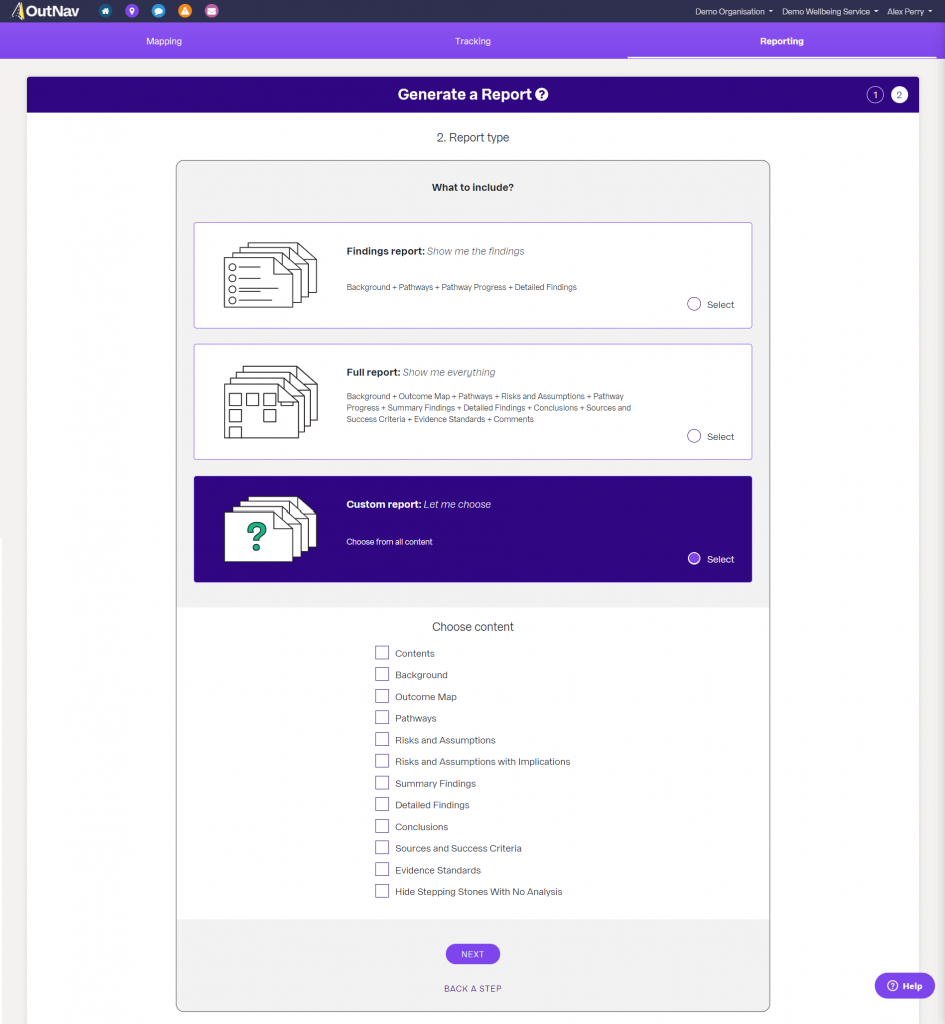
Choose what goes into your report
Your reports can focus on any number of the pathways you have plotted through your outcome map. After selecting which pathways to report on, you have the flexibility to choose what content to include. There are some preset options or you can run a custom report.
If you are generating a custom report, you can choose what to include by checking a series of boxes. One important thing to consider is whether you wish to include summary findings (which are added using the step summary feature and provide an overview of each column of your outcome map) or detailed findings (the more in-depth analysis done within individual stepping stones). For longer reports, you can choose to include both.
Live data
The content of your report is live – pulled directly from your OutNav project, so any changes you make within OutNav will be reflected in your shared reports.
To take a static snap-shot, you can download your report as a Microsoft Word file and save it offline or in OutNav. Word files can be opened in other document editing platforms such as Google Docs: handy for extracting content for publications such as annual reports.
Sharing reports
OutNav reports can be shared with anyone – inside or outside your OutNav organisation. They can be shared by email, or by generating a link, and can be password protected if you need them to be.
Smart navigation

Quickly navigate to different sections of your live reports with linked Contents screens.
There is also enhanced navigation through each pathway you have included in your report. Clicking on any stepping stone within your colour-coded pathway map in a live report will jump you straight to the summary of progress for that step. You can also move easily between the analysis for different levels (columns) in your pathways.
Live editing

In previous OutNav key feature posts we have talked about the benefit of reporting frequently on your progress for ongoing learning and development. Sharing a live report with your OutNav team members brings an added ‘Edit’ feature, which provides a quick link to update your analysis directly from the report.
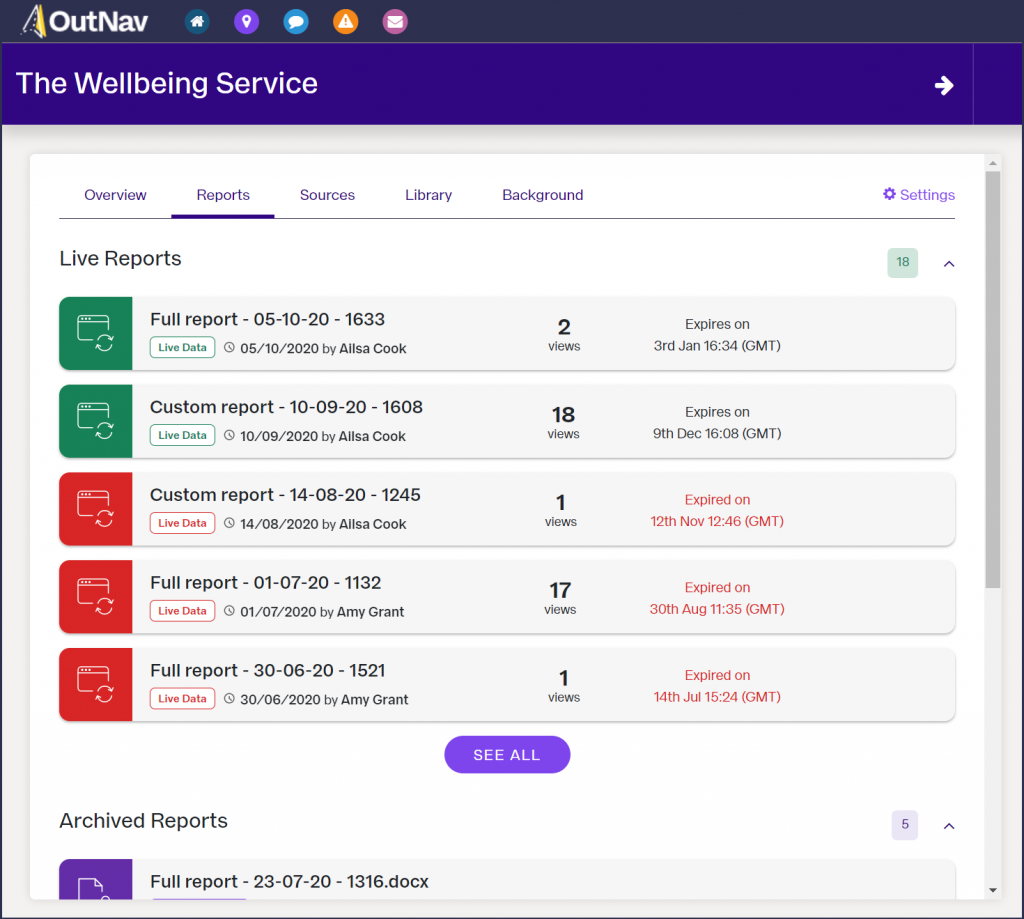
Keeping track of reports
From your OutNav project’s overview page you can see what live reports have been generated, when they expire, how many times they have been viewed, whether it has been shared beyond your organisation and how (by email or link).
Making your reports visually appealing
Customise your report cover
The controls that appear next to the first page of your newly generated report allow you to easily change the colour and design of the report cover.
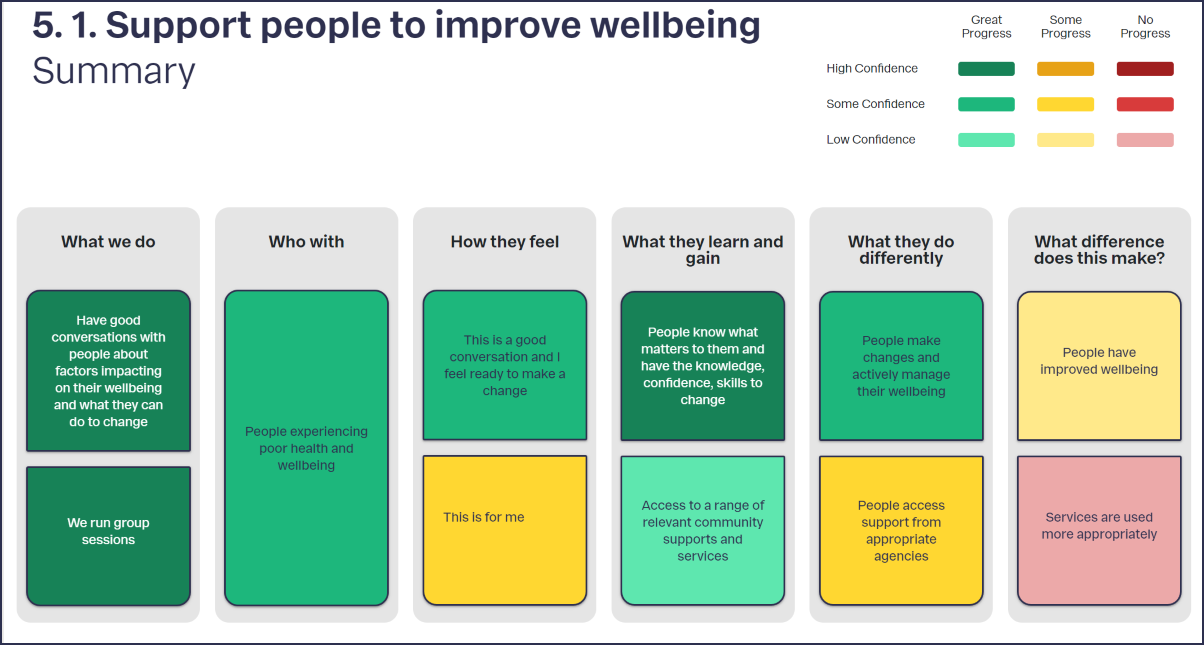
Colour-coded outcome maps
OutNav supports an iterative approach to assessing your progress towards success by allowing you to rate both your progress and confidence in your data, producing a colour-coded outcome map. See Track your progress and impact in OutNav.
Incorporating your colour-coded outcome maps into reports immediately brings visual appeal as well as providing a quick visualisation of your progress. But we encourage you to make your analysis visually engaging too.
WYSIWYG formatting

Familiar formatting features are built into the analysis fields of each stepping stone, so that you can add structure to your summary of evidence and progress, and add impact to words you want to highlight, such as quotes.
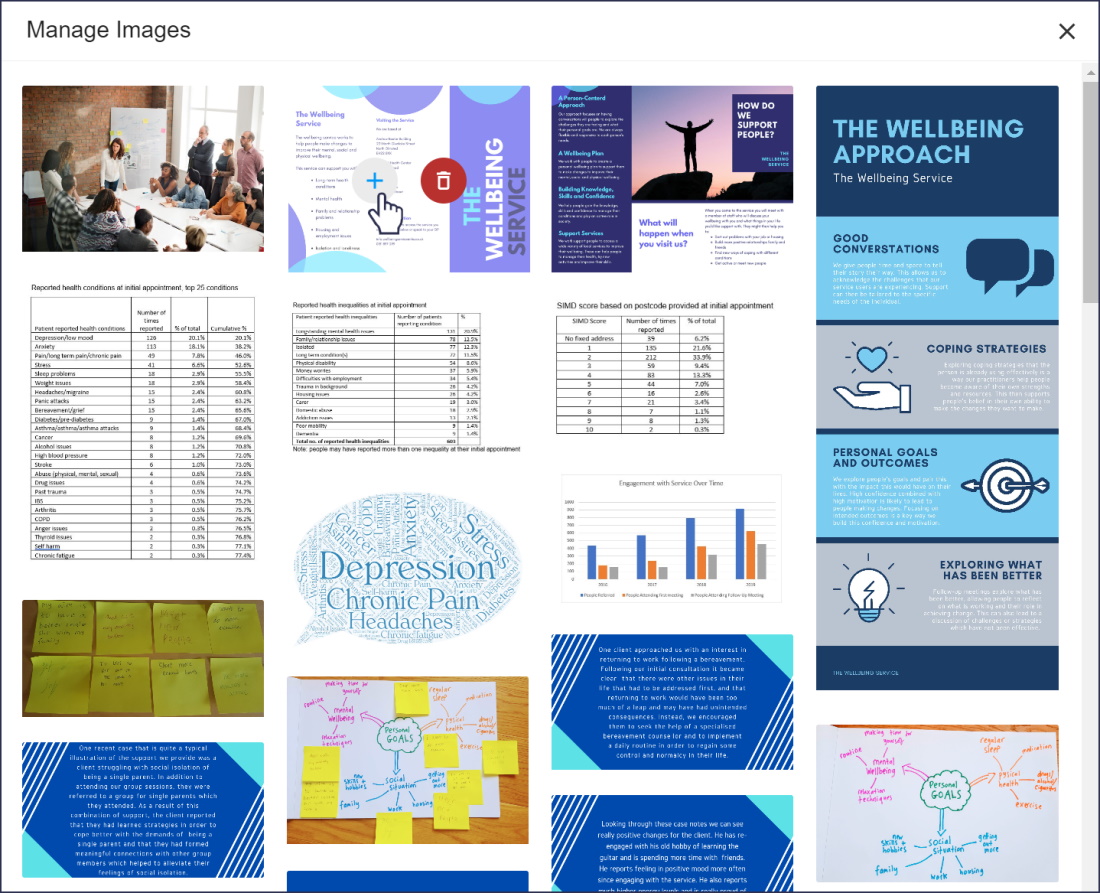
Images
Using images is a great way to illustrate the successes of a project or programme, and might include colourful graphs, infographics, wordclouds, photos of activities in action or handwritten feedback.
With OutNav’s upload graphics feature you can insert PNG or JPEG images and GIFs directly into the summary of analysis in a stepping stone. These will then feature in your OutNav reports. Once an image has been uploaded, it is stored in a graphics tray that is accessible to all stepping stone analysis pages.
If you have video evidence hosted online you can incorporate links to these from your live reports.
OutNav Community member Catherine Wilson from Starcatchers (Scotland’s National Arts and Early Years Organisation) is an expert in creating visually engaging reports to tell the story of their Creative Skills Programme. Find out more in her guest post ‘Understanding creative impact‘.
Using OutNav’s Image Creator
OutNav’s Image Creator feature makes it easy to create simple but effective images to highlight key quotes, statistics and findings from your analysis.
Create images with just a few clicks from within your OutNav project. Choose from a variety of pre-made layouts and incorporate other images into your design.
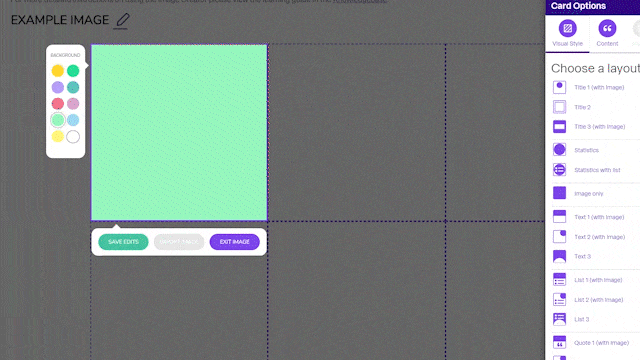
The Content tab of the Image Creator lets you see your analysis without having to navigate to another page, meaning you can easily refer to work you have already done, and even copy and paste sections of text right into your new image.
Once you have created an image you are happy with, you can download it or save it to the Image Manager, making it easy to bring the image straight into your analysis to add some more visual interest to your reports.
An OutNav subscription includes ongoing learning and support with the OutNav Community for every member of your team.
If you would like a live demo of OutNav please get in touch and we would be happy to schedule a time to show you around.
how to get in touch